01
Crater detection
- LROC WAC imagery
- NASA-IBM LFM
- Crater candidates
80,454 detections
over 1,000 analyzed tiles
SystemOnline
Moonatlas / Science · science-0.3.1
Real lunar observations. Real model outputs. Reproducible processing.
MOONATLAS runs publicly released NASA-IBM Lunar Foundation Model checkpoints over the public SomBench benchmark samples, offline and on one GPU, then publishes the results as a static catalogue you can explore geographically. The web application never runs a model: it reads what the pipeline produced, with the provenance of every value.
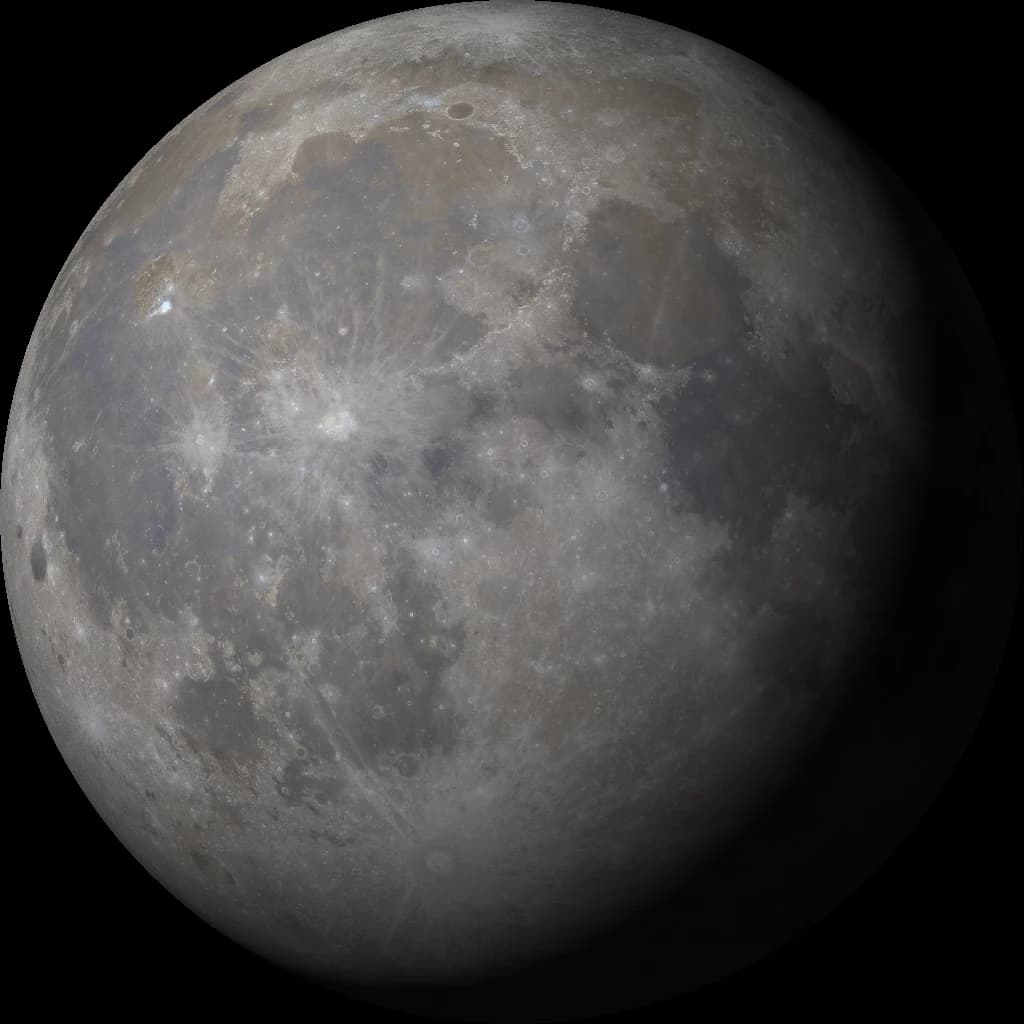
WAC tiles analyzed
1,000
SomBench crater strips
Crater model detections
80,454
not unique craters
ICE patches analyzed
156
78/81 north · 78/81 south
IMP observations
130
104 targets
Model predictions
80,740
detections, maps and masks
Curated discoveries
97
42 held-out · 55 in-sample
01
MOONATLAS was built when the ingredients became publicly available. What happened upstream is marked UPSTREAM FACT; why MOONATLAS exists is our own motivation, and is marked as such.
Chapter 01
NASA
IBM
Lunar Foundation Model
Multimodal · multiresolution
SomBench
Lunar task benchmark
Public models
Datasets
Checkpoints
Open scientific building blocks
Reusable outside the original teams
NASA and IBM released a multimodal, multiresolution foundation model for lunar remote sensing, together with SomBench — a benchmark of lunar science tasks — and trained checkpoints for those tasks.
That release is what made this project possible: lunar observations, task datasets and trained models became usable by people outside the original teams. MOONATLAS is one of those outside uses. NASA and IBM did not build it, review it or endorse it.
Upstream fact
Fraccaro, P. et al. (2026); Patil, H. et al. (2026). Full citations in data & sources.
Chapter 02
Lunar missions have returned enormous quantities of imagery and remote-sensing data. Working with it normally means specialist tools, geospatial processing, machine-learning infrastructure and familiarity with each individual dataset.
Reusable lunar AI changes what can be built on top of that archive. The training, the benchmarks and the task definitions are already public. What was missing was an interface.
Lunar Reconnaissance Orbiter Camera
LROC WAC and NAC imagery
Lunar Orbiter Laser Altimeter
LOLA topography (slope, aspect, curvature)
Diviner Lunar Radiometer Experiment
Diviner thermal observations (maximum temperature, ice stability)
Specialist tools
Geospatial processing
ML infrastructure
Domain knowledge
Foundation models made another interface possible
Chapter 03
What if you could
point at the Moon
and ask:
“What do we know about this place?”
No GeoTIFF to download. No notebook to run. Point at the Moon and get an answer — including the answer “nothing has been analyzed here”.
This question became MOONATLAS.
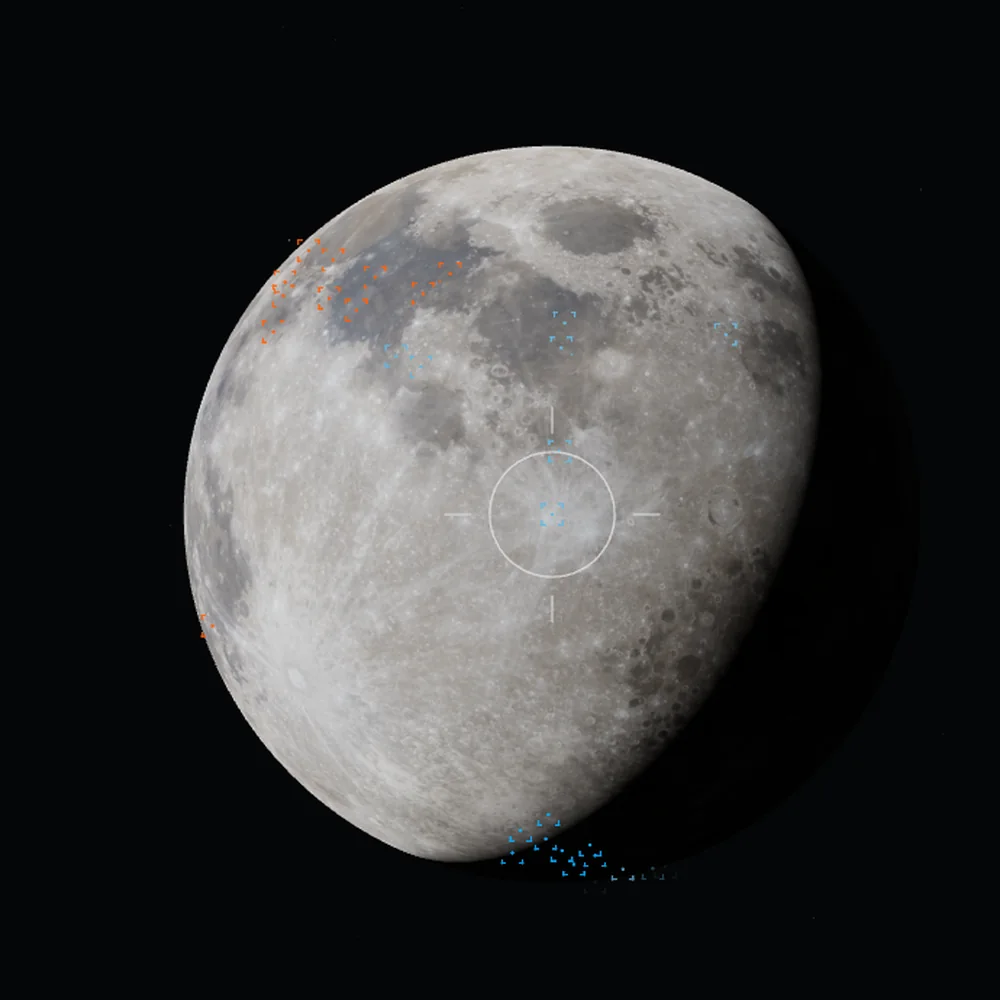
Still from the MOONATLAS explorer · camera centred on this coordinate · reticle drawn by the explorer at that location
Chapter 04
Normally encountered as
Put back onto
The Moon itself
becomes the interface
Lunar missions
LRO instruments
Scientific observations
Imagery, topography, thermal
NASA-IBM lunar AI
Foundation model + task training
Public models + SomBench
Apache-2.0 · CC-BY-4.0
MOONATLAS processing
Offline inference, normalization
Geographic model outputs
Georeferenced, provenance kept
The Moon
+
Human exploration
MOONATLAS deliberately avoids presenting the science as files. Every output is placed back where it was observed, so the archive can be read the way the Moon is read: by looking at a place.
Chapter 05
01
Accessibility
Lunar analysis without a geospatial toolchain
02
Exploration
A place to go, not a table to read
03
Scientific curiosity
Questions a visitor can ask themselves
04
Transparency
Every value says where it came from
MOONATLAS is not intended to replace lunar scientists. It explores whether advanced lunar AI outputs can be turned into an interface that makes people want to investigate the Moon themselves.
Make the science accessible
without pretending
it says more than it does.
No coverage
The report says there is no NASA-IBM LFM coverage here
Unmatched crater
Never called new, unknown or discovered
Ice prospectivity
Never called a probability of ice
Uncalibrated score
Labelled uncalibrated everywhere it appears
Select any place
Check real coverage
Query catalogued model outputs
MOONATLAS report
80,740 catalogued model outputs, georeferenced onto the Moon. The report states the coverage that actually exists at the coordinate you picked, even when there is none.
Select any place
Acquire lunar observations
Run lunar AI
New inference
MOONATLAS report
A future version could acquire the observations covering an arbitrary target and run a new inference for it. This does not exist today, and no date is promised.
02
A foundation model is trained once on a large amount of data and then adapted to specific tasks. The NASA-IBM Lunar Foundation Model (LFM) is trained on lunar remote sensing across several instruments and resolutions; task checkpoints adapt it to detect craters, to regress polar ice prospectivity and to segment irregular mare patches.
SomBench is the public benchmark that accompanies it: the lunar samples those tasks are trained and evaluated on. SomBench samples are the only places MOONATLAS analyses, which is also why coverage is limited — see what MOONATLAS has analyzed.
Lunar observation
LROC WAC / NAC, LOLA, Diviner
NASA-IBM LFM
Shared multimodal backbone
Task model output
Boxes · regression field · mask
MOONATLAS normalization
Georeferencing, raw + display
Geographic exploration
Layers on the Moon
Discoveries
Curated, permanent ids
Inference ran locally on a single GPU with the upstream configurations and strict checkpoint loading. Nothing in the interface is generated by a language model, and no value is invented or interpolated.
03
01
80,454 detections
over 1,000 analyzed tiles
02
156 patches
both poles, full valid grid
03
130 observations
104 target groups
04
The model predicts crater regions on a WAC tile as boxes with a confidence. MOONATLAS converts each box into lunar coordinates and an approximate diameter using the tile's own projection, then compares predictions with the Robbins (2019) global crater catalogue.
A model prediction and a reference annotation are different things and are never merged. A match means the prediction overlaps a catalogued reference crater under the configured criterion (IoU ≥ 0.5, greedy by confidence).
No match does not mean a new crater. It means no reference crater matched under that criterion — the reference catalogue has its own completeness limits, the box may be imprecise, and the feature may not be a crater at all. MOONATLAS labels those candidates “unmatched with Robbins” and never “new”, “unknown” or “discovered”.
Tabs switch the same tile between the source observation, the model prediction and the reference annotation; the highlighted box is the catalogued discovery.
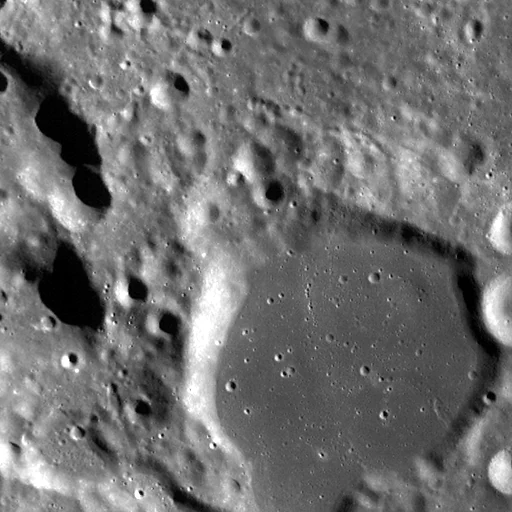
M1244734512CE · 117 predicted boxes · 144 Robbins (2019) reference boxes
05
The ice task is a regression: from multimodal polar observations — illumination, thermal, topography — the model produces a dense field that emulates a knowledge-driven expert prospectivity map (Coyan et al., 2025) on a 0–1 target scale.
A value of 0.93 means high modelled prospectivity. It is not a 93% chance of ice, and it is not a measurement of ice. Prospectivity says “this terrain resembles the terrain the expert map favours”.
The regression is unconstrained, so raw outputs can fall slightly outside the target scale. MOONATLAS preserves every raw value and clips only the colours — hover the field and the readout quotes the raw model output, and says when the colour was clipped.
patch_0003_0002_S_80S · 256 × 256 px · hover for the raw model value
Raw model output · preserved
Display · clipped to the 0–1 target scale
06
The IMP task segments the pixels of a 256 m LROC NAC tile that belong to an irregular mare patch candidate. From that mask MOONATLAS derives the predicted area, the pixel count, the share of the tile it covers and its centroid — all MOONATLAS derived metrics computed from the model output.
The mean class-1 softmax reported in the inspector is uncalibrated. It orders pixels; it is not a probability, and it must not be read as one.
An IMP candidate is not an active volcano. Irregular mare patches are small, unusual mare features whose origin is debated in the literature; the model segments a candidate feature, nothing more. Reference polygons come from Hargitai et al. (2025), as packaged in SomBench.
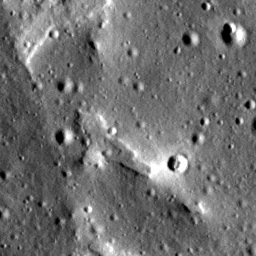
M1126915118RE · 256 m tile · 1.00 m/px · masks at native resolution
07
Everything below is read from the published catalogue at build time. Note the wording: 80,454 model detections, not craters discovered.
WAC tiles analyzed
1,000
SomBench crater strips
Crater model detections
80,454
not unique craters
Polar ice patches
156
both poles
Valid grid cells
78 / 81 · 78 / 81
north · south
IMP observations
130
LROC NAC tiles
SomBench target groups
104
repeat observations grouped
Model predictions
80,740
detections, maps and masks
Curated discoveries
97
42 held-out · 55 in-sample
08
The models only ran where SomBench has samples. The Moon is fully explorable in MOONATLAS, but model coverage is not global, and the interface says so instead of implying analysis everywhere.
Surface covered
3.88%
1.47M km²
Summed tile area
2.62M km²
tiles overlap each other
Geographic areas
12
strips, 300 km apart
Held-out test ground
0.66%
0.25M km²
The 926 distinct footprints of the 1,000 analyzed WAC tiles cover about 1.47M km² — 3.88% of the lunar surface — in 12 strips. Their areas add up to 2.62M km², and the difference is overlap: SomBench tiles share ground with each other.
That overlap is also why a detection count is not a crater count. 53,842 of the 80,454 detections (66.92%) have a similar detection in another tile. MOONATLAS does not deduplicate them, because each tile prediction is an authentic model output on its own observation.
The polar task runs on a fixed stereographic grid per pole. MOONATLAS processed 78 of 81 cells in the north and 78 of 81 in the south: every cell that contains valid pixels inside the dataset extent. The remaining three cells per pole contain none, and they stay empty rather than being filled in.
This means all valid coverage available to this model and dataset configuration has been processed. It does not mean lunar ice has been mapped.
3 cells hold no valid pixels · cell brightness follows its valid-pixel share
3 cells hold no valid pixels · cell brightness follows its valid-pixel share
130 NAC observations, grouped into 104 SomBench target groups — several tiles can image the same annotated target, and MOONATLAS groups them by that upstream target id for navigation only. The term is observation group, not “site”: the upstream data establishes which annotation a tile was framed on, not that two observations show the identical physical feature. Their masks are never merged.
These are geographically limited observations on the nearside mare, marked in amber on the map above. Nothing here is a global volcanic survey.
09
You can lock any coordinate on the Moon, including ground no model has ever seen. MOONATLAS queries the catalogue it published and reports what is actually there.
You select a target
Any lunar coordinate
Coverage is checked
Which models reach that ground
Model outputs retrieved
Catalogued predictions there
Nearby analyses searched
Nearest tiles and discoveries
Exploration report
Including “no coverage”
Where there is no NASA-IBM LFM coverage, the report says so: it names the surface imagery it can show, the distance to the nearest analyzed tiles and the nearest curated discoveries. It never invents a value for a place no model looked at.
In this version, exploring queries precomputed real model outputs. Pressing the button does not start a new GPU inference. The autonomous scan and the exploration feed are replays of catalogued results for the same reason.
Next frontier · not available today
Select any place
Acquire lunar data
Run lunar AI
Analyze
Report
A future version could acquire the observations covering an arbitrary target and run a new inference for it. This is a direction of travel, not a feature of this release, and no date is promised.
10
Held-out test
Observations that were not used as training samples for the downstream task, kept aside for independent evaluation. Performance numbers — ours and the model cards' — come only from here.
135 analyzed samples · 42 discoveries
Training and validation · in-sample
Equally real observations and equally real model outputs, published because they extend geographic coverage and are worth exploring. They are not independent evidence of model performance, and MOONATLAS labels them everywhere they appear.
1,151 analyzed samples · 55 discoveries
Held out does not mean physically more important, and in-sample does not mean invalid or fake. The badge describes evaluation provenance, nothing else.
11
Before publishing anything, MOONATLAS re-runs the released checkpoints with the upstream configuration over the held-out test split and compares the result with the published model cards. This is an engineering validation of the pipeline — evidence that inference, georeferencing and metrics were wired correctly — not a competition with the original teams.
| Metric | Model card | MOONATLAS held-out |
|---|---|---|
| mAP | 0.2581 | 0.2602 |
| AP@50 | 0.6183 | 0.6239 |
Upstream test configuration, recomputed over the 100 held-out tiles of this build.
| Metric | Model card | MOONATLAS held-out |
|---|---|---|
| IoU class 1 | 0.5709 | 0.5824 |
| F1 class 1 | 0.7268 | 0.7361 |
Ten held-out tiles: a small sample, so small differences from the card are expected in both directions.
The ice checkpoint publishes regression errors rather than a per-split benchmark table, so MOONATLAS reports its own RMSE and MAE against the reference map per patch instead of claiming a reproduction score.
Train and validation metrics exist in the same reports and are deliberately not shown here: they are in-sample and would overstate what the pipeline demonstrates.
12
Four kinds of value exist in MOONATLAS and they never blur into each other. This is the rule the whole product is built on.
Raw model output
Exactly what the model produced
Normalized science data
Georeferenced, structured, validated
Display representation
Clipped and coloured for rendering
MOONATLAS derived metric
Areas, ranks, distances, navigation
Raw is the model result as produced, preserved even when it falls outside a target scale. Normalized is that result placed on the Moon with its projection, units and provenance, and validated against the published schemas.
Display is the transformation needed to draw it — clipping, colormaps, opacity. Derived is arithmetic MOONATLAS does on top, such as a predicted area or a diameter rank.
Display values are never reported as if they were raw model output, and MOONATLAS-derived values are never presented as NASA or IBM outputs. Every metric in the interface carries its origin badge.
Provenance carried by every object
The same stack appears on every discovery page and in the explorer's inspector.
13
What this system does not do, stated plainly. This list is part of the product, not a disclaimer.
Analyzed WAC tiles cover 3.88% of the surface in 12 strips. Elsewhere there is no crater model coverage.
Source tiles overlap: 66.92% of detections have a similar detection in another tile, and they are not deduplicated.
A prediction without a Robbins match under the configured criterion is not evidence of a previously unknown crater.
It is a regression against a knowledge-driven expert map, not a measurement or a likelihood of ice.
Raw outputs run from -0.136 to 1.119; MOONATLAS preserves them and clips only the display.
It ranks pixels within a mask. It is not a probability that a feature is an irregular mare patch.
The model segments a candidate volcanic feature on one NAC tile; origin and activity are not claimed.
They extend coverage and exploration, and are never independent evidence of model performance.
Robbins (2019), Coyan et al. (2025) and Hargitai et al. (2025) are published expert work, shown for comparison only.
In this version it searches precomputed model outputs; it does not execute live inference.
14
Everything MOONATLAS analyses belongs to someone else. Upstream models are Apache-2.0, SomBench datasets are CC-BY-4.0 (attribution required, changes indicated), and reference annotations belong to their authors. MOONATLAS's own code is Apache-2.0.
Fraccaro, P. et al. (2026). Multimodal-Multiresolution Foundation Model for Lunar Remote Sensing. NASA-IBM AI4Science.
Apache-2.0 · f29ade2
Fraccaro, P. et al. (2026). Multimodal-Multiresolution Foundation Model for Lunar Remote Sensing. NASA-IBM AI4Science.
Apache-2.0 · f09ebea
Fraccaro, P. et al. (2026). Multimodal-Multiresolution Foundation Model for Lunar Remote Sensing. NASA-IBM AI4Science.
Apache-2.0 · fb0510d
Fraccaro, P. et al. (2026). Multimodal-Multiresolution Foundation Model for Lunar Remote Sensing. NASA-IBM AI4Science.
Apache-2.0 · 10a09ff
Patil, H. et al. (2026). SomBench: Benchmark Dataset for Advancing Machine Learning in Lunar Science. NASA-IBM AI4Science.
CC-BY-4.0 · modified · 20f800b
Patil, H. et al. (2026). SomBench: Benchmark Dataset for Advancing Machine Learning in Lunar Science. NASA-IBM AI4Science.
CC-BY-4.0 · modified · 7804050
Patil, H. et al. (2026). SomBench: Benchmark Dataset for Advancing Machine Learning in Lunar Science. NASA-IBM AI4Science.
CC-BY-4.0 · modified · 1418851
Robbins, S. J. (2019). A New Global Database of Lunar Impact Craters >1–2 km. JGR Planets, 124(4), 871–892.
Publication
Coyan et al. (2025), knowledge-driven fuzzy-overlay polar ice prospectivity map, as packaged in SomBench.
Publication
Hargitai et al. (2025), irregular mare patch polygon annotations, as packaged in SomBench.
Publication
LRO LROC WAC and NAC imagery.
Public data
LRO LOLA topography (slope, aspect, curvature).
Public data
LRO Diviner thermal observations (maximum temperature, ice stability).
Public data
NASA's Scientific Visualization Studio, CGI Moon Kit (LRO LROC and LOLA data).
NASA media guidelines · modified
Changes MOONATLAS makes to upstream data — crops, normalization, georeferencing, display encodings — are indicated by the “modified” flag above and described throughout this page. No NASA or IBM insignia are used, and no endorsement is implied.
Ready to look at the Moon? Open the explorer or browse the discoveries.